(Experimental) Overview Map
Real-time Progress and Precision Navigation at Your Fingertips.
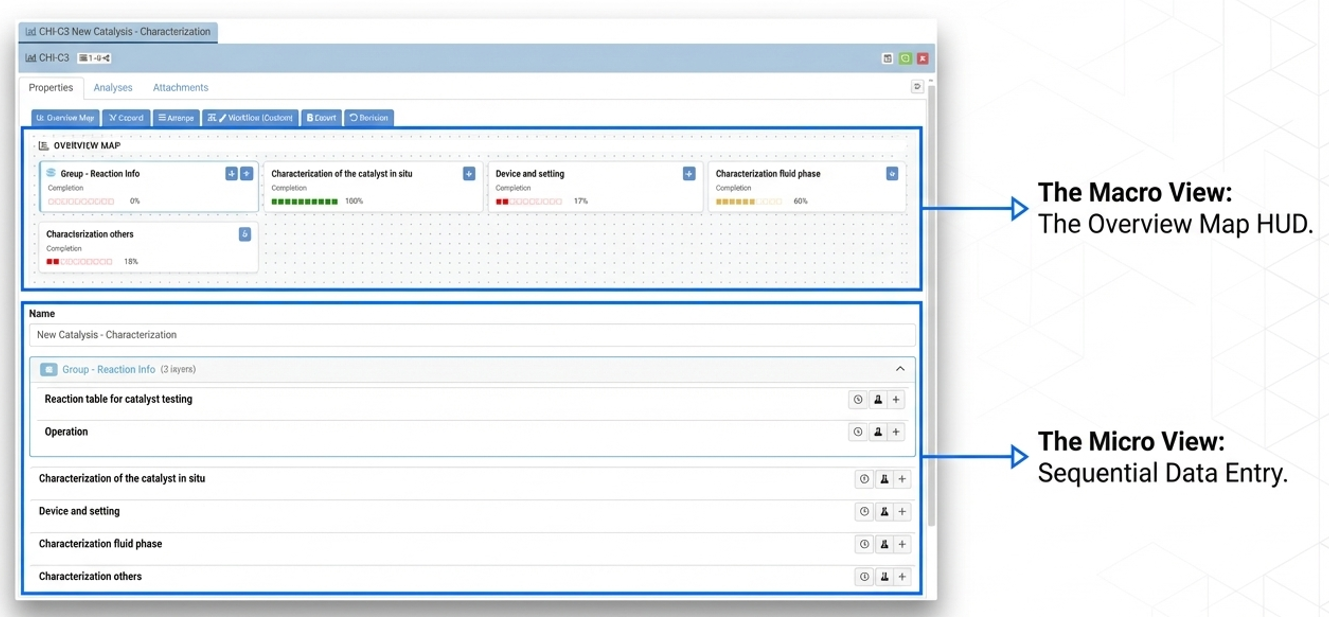
The Overview Map feature provides a visual dashboard at the top of your form to track data entry progress and streamline navigation. Instead of scrolling through long, multi-layered forms, you can see a high-level summary of your completion status and jump directly to any section with a single click.
Table of Contents
How It Works
Audience: Users
Interface: Chemotion ELN – MyDB view
The Overview Map acts as a “mission control” for your data entry process. Each section of your form is represented as a card that monitors your activity in real-time [1]. This is especially useful for intricate forms where multiple sections and sub-tasks must be tracked simultaneously.
Primary Benefits:
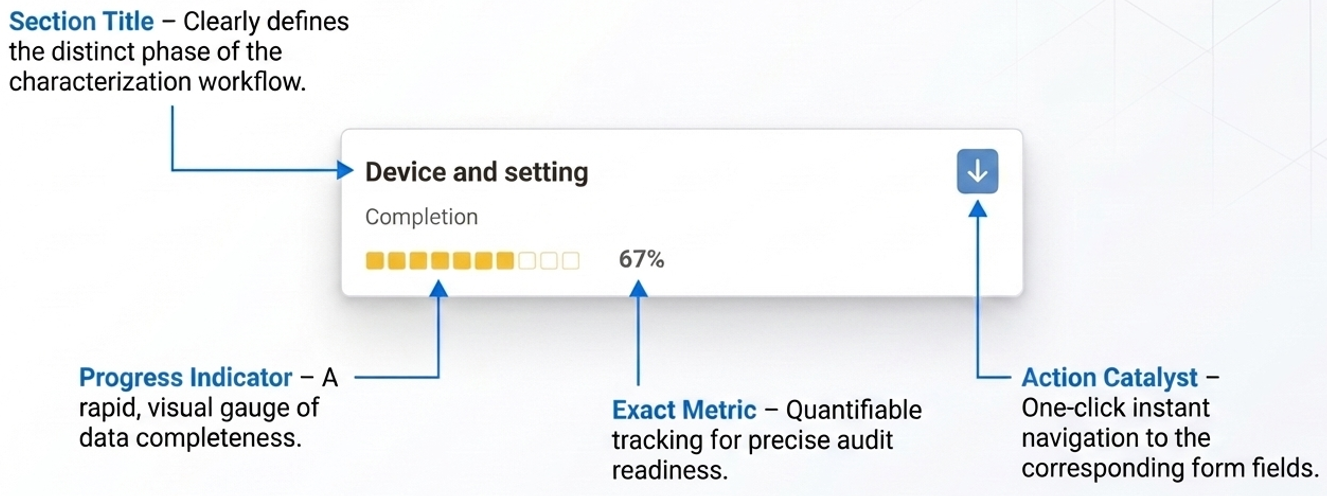
- Progress Visibility: Instantly see which sections are complete via color-coded bars and completion percentages.
- Rapid Navigation: Use the blue “↓” icons on map cards to instantly bypass long forms.
- Precision Focus: Target sections are briefly highlighted in yellow upon arrival so you can immediately find your place.
- Layered Tracking: Expand grouped sections (like “Reaction Info”) within the map to monitor the progress of specific sub-tasks across multiple layers.
Logic Steps: The system tracks input fields to provide live feedback as you work.
-
Input Detection: The user enters data into form fields, such as “Time,” “Pressure,” or “Observation”.
-
Progress Calculation: The system automatically calculates the completion percentage for that specific section.
-
Map Update: The corresponding card in the Overview Map updates its color bar and percentage instantly, such as moving from 17% to 67%.
-
Navigation Trigger: The user clicks the blue arrow icon on a map card.
-
Auto-Scroll & Highlight: The page automatically scrolls to the section and highlights it in yellow.
Example Scenario
Imagine you are filling out a “New Catalysis - Characterization” report. The Overview Map helps you track multiple sections simultaneously.
| Action | Resulting Map/Form State | Screenshot Reference |
|---|---|---|
| Initial State | “Device and setting” shows 17% completion with a red progress bar. | 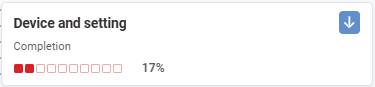 |
| Enter Time, Pressure, and Observation | Completion percentage jumps to 67% in real-time. | Data entered |
| Map Updates Instantly | The bar turns orange and shows 67% completion. | 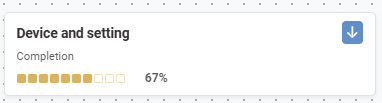 |
🚀 How to Participate in the Preview
Follow these steps to explore the new features and share your insight:
🖥️ Visit the Staging Instance
Access the preview environment at: labimotion-stage.ibcs.kit.edu🔍 Explore and Test
Try out the enhancements — see how they fit your workflow.❤️ Your Feedback Matters
Share your comments or report any issues in our GitHub Discussion Thread.
We appreciate your help in testing these new features!